
Incrementality Experiments: How Much AI Revenue a Page Change Added
Revenue Attribution → Experiments compares the pages you changed with pages you did not, and shows the incremental AI revenue, leads or visits with a 95% range. When to use it, how to set one up and how to read the result.
When to use it
You changed a set of pages (rewrote the pricing page, added comparison pages) and want to know how much more AI revenue the change brought. Looking only at those pages before and after is not enough: AI traffic to the whole site may have risen or fallen at the same time. An experiment compares the changed pages (test group) with unchanged pages (control group), removes the change both share, and what remains is the increment.
Where: Revenue Attribution → Experiments. Revenue attribution needs data first (at least the site script installed).
Set up an experiment
- 1
Click New experiment
- 2
Enter Name and Start date
Use the day the change went live. It can be in the past.
- 3
Fill in Test pages (changed)
Page paths separated by commas, for example /pricing, /compare/. matches anything, so /compare/* means every page under /compare/.
- 4
Fill in Control pages
Pages you did not change. Leave empty for all other landing pages (every landing page outside the test group).
- 5
Choose a Metric
AI revenue, AI leads or AI visits.
- 6
Set Days to compare
The same number of days before and after the start date: 30 by default, 7 to 120 allowed. Click Save.
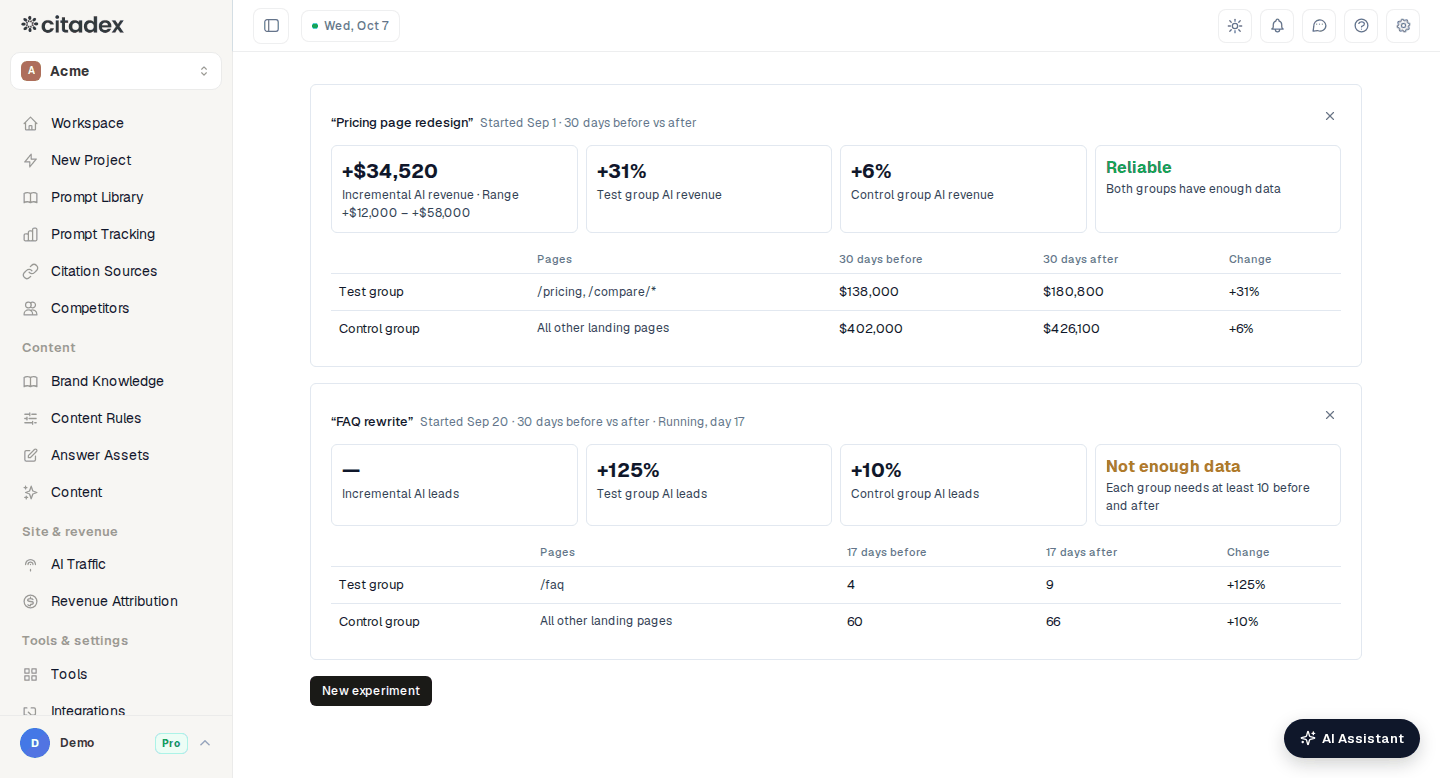
Revenue Attribution → Experiments
Read the result
Each experiment is a card headed "Started {date} · N days before vs after".
- Incremental: the extra AI revenue (or leads, visits) the change brought, followed by Range a – b, the 95% range. The control group's before-to-after change gives what the test pages would have done without the change; the actual value minus that is the increment.
- Test group / Control group change: each group's percentage change after vs before.
- Reliable / Not enough data: when both groups have at least 10 before and 10 after (won orders for revenue, leads for leads, visits for visits) the card shows Reliable and the incremental number. If any group has fewer than 10 in either period it shows Not enough data and no number.
- Table: Pages, N days before, N days after and Change for each group. With an empty control group the pages column reads All other landing pages.
An experiment still in progress shows Running, day N: before and after both use only the N days so far, and the result settles once the full period has passed. Before the start date it shows Not started yet.
FAQ
It says Not enough data. Wait for more days, create a new experiment with more days to compare, or switch the metric to AI visits, which has larger counts.
What does a range that crosses 0 mean? Within the 95% range the increment could be positive or negative, so this change cannot yet be told apart from no change.
Which control pages should I use? Usually leave it empty. If you changed other pages at the same time, list only pages that really stayed the same.
How do I delete an experiment? Click ✕ in the card's top-right corner. Viewers can see experiments but cannot create or delete them.
Was this article helpful?